Turn your data science skills into a live web app in just a few steps.
By Olubisi Ajetunmobi
If you’re trying to move from data analysis into data science, artificial intelligence, or software development, building real, interactive apps can be a game-changer for your portfolio.
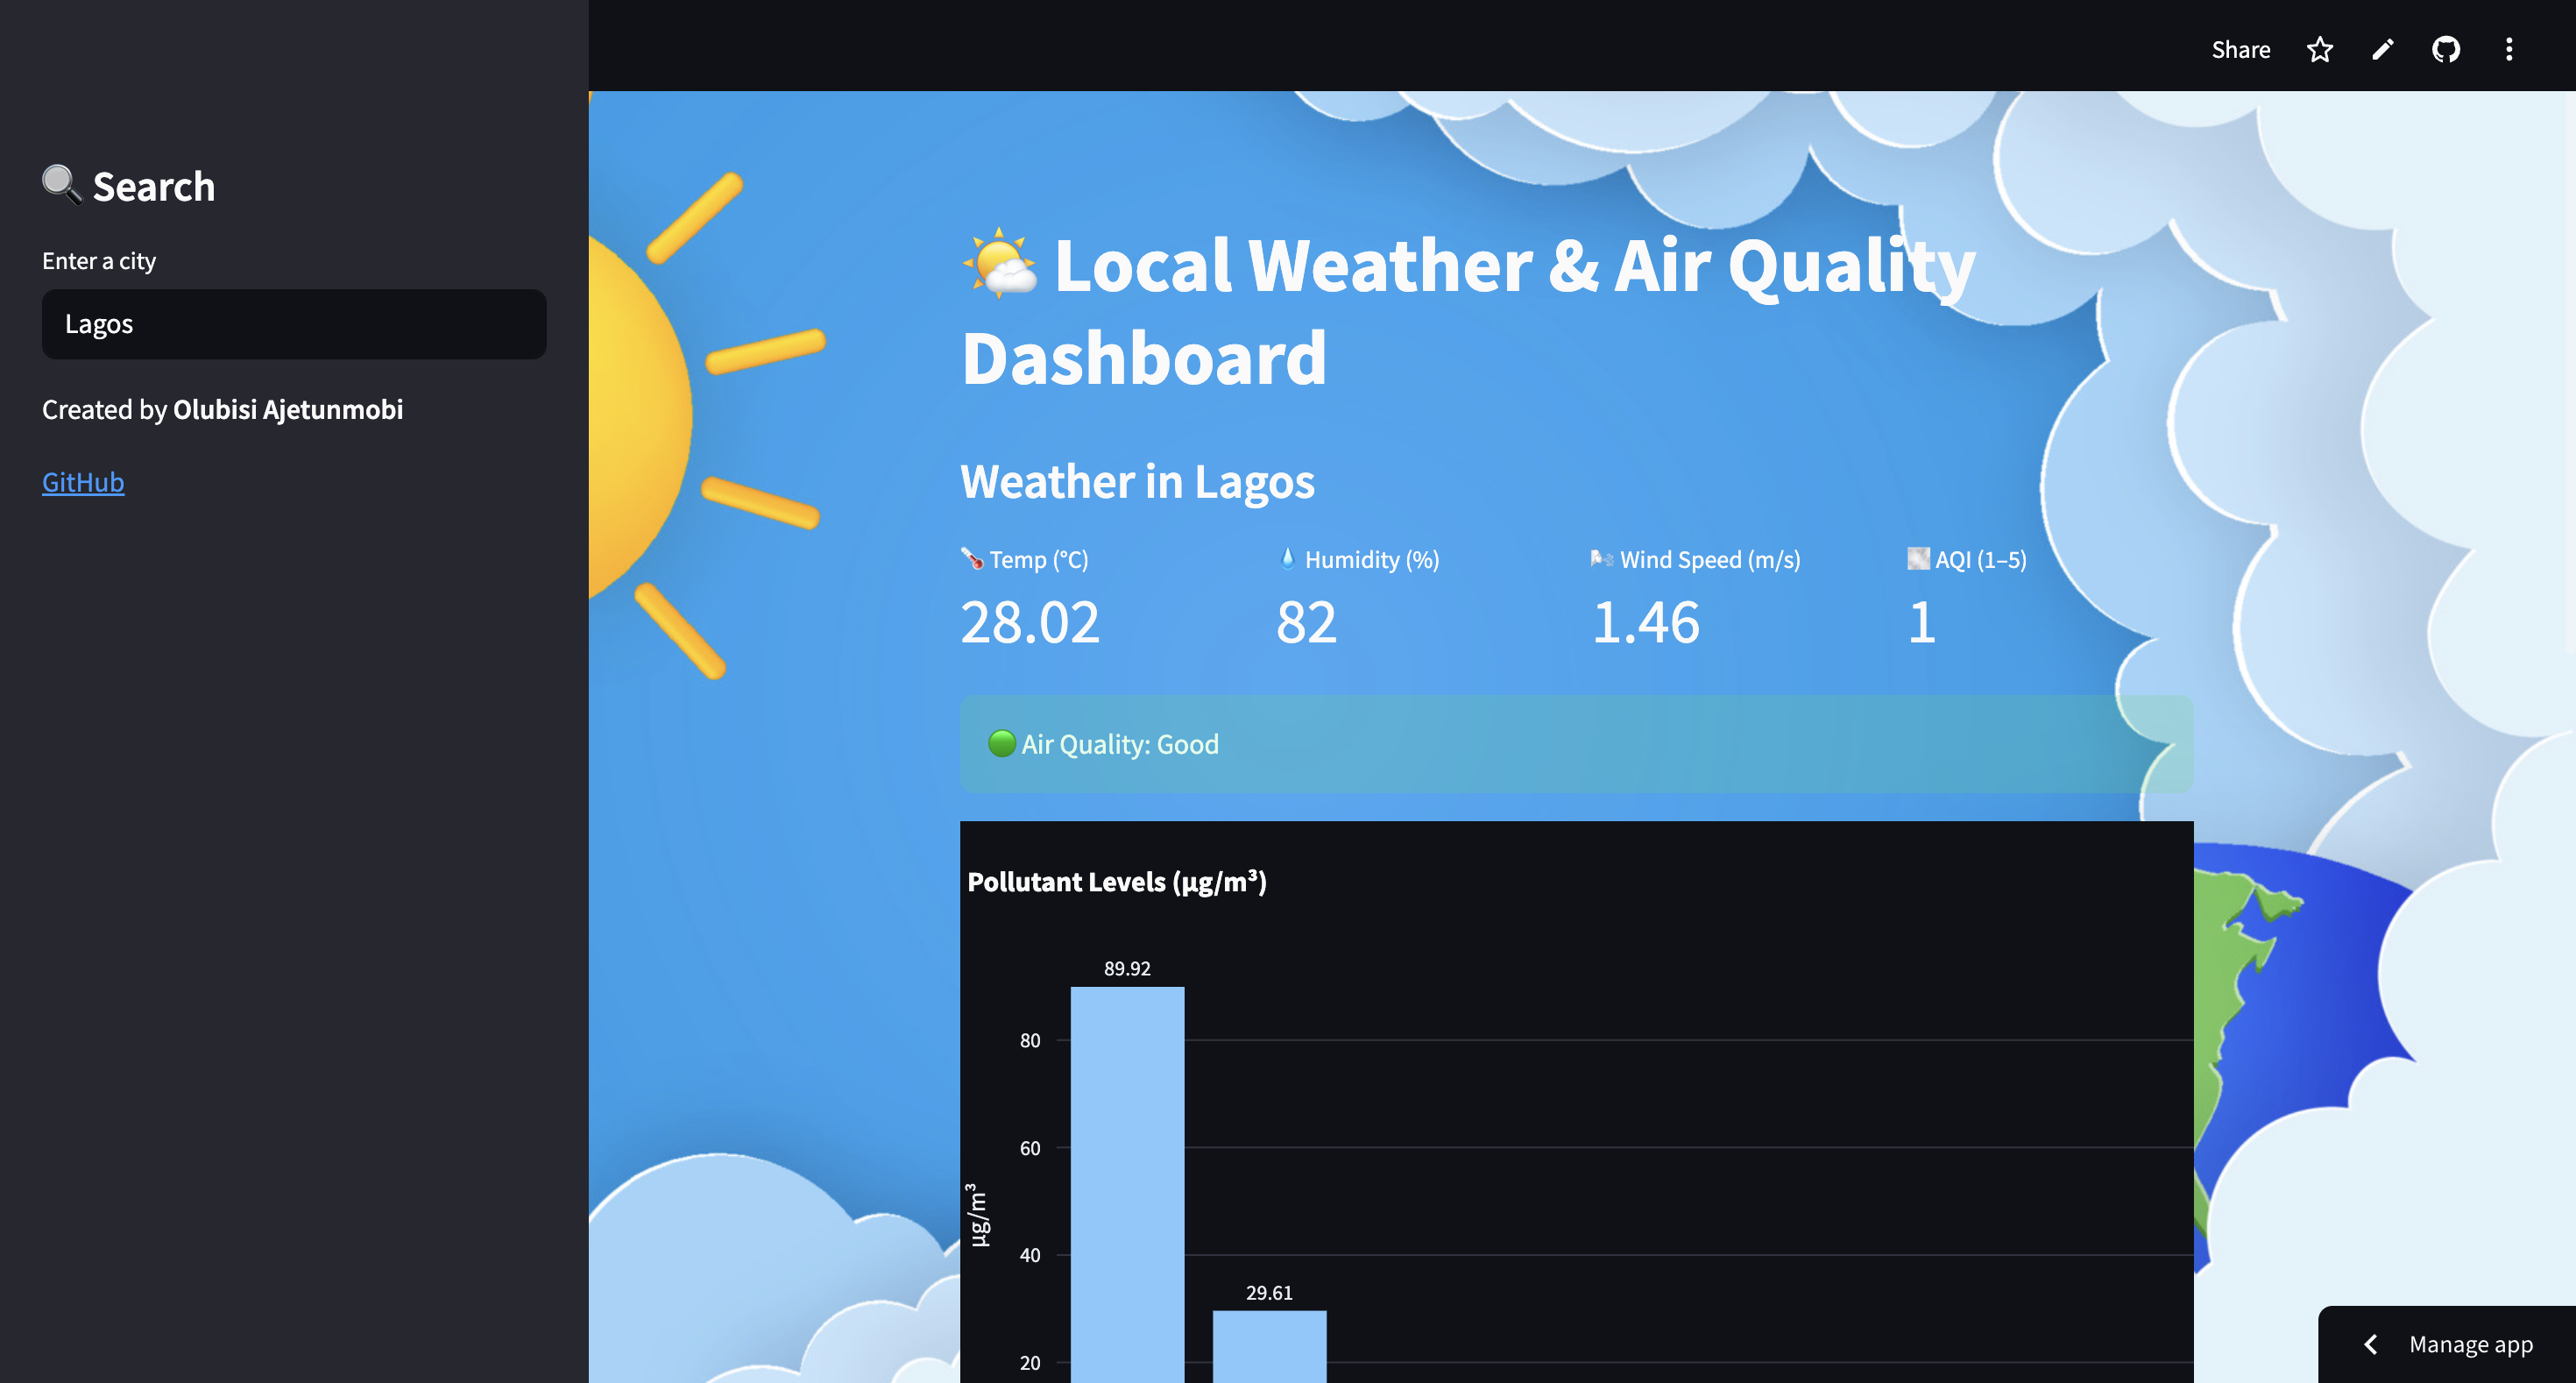
In this post, I’ll show you how I built a real-time weather and air quality dashboard using Streamlit, Python, and the OpenWeatherMap API — all deployed on the web for anyone to use.
It’s the kind of hands-on, end-to-end project that demonstrates skills in:
- Live API integration
- Real-time data visualization
- Building data apps without needing frontend code
- Cloud deployment
🚀 What This Weather and Air Quality App Does
This Streamlit-powered dashboard allows users to:
✅ Enter any city in the world
✅ View live weather data (temperature, humidity, wind speed)
✅ See the current Air Quality Index (AQI) and pollutant concentrations (e.g., PM2.5, CO, NO₂)
✅ Explore the location on a live interactive map
✅ View a bar chart of pollutants sorted from highest to lowest
✅ Enjoy a clean, responsive design with a custom background image
👉 Live demo: [Insert your Streamlit app link here]
📂 GitHub repo: [Insert GitHub repo link here]
🛠️ Tools and Technologies I Used
🐍 Python
I used Python as the foundation for everything — fetching API data, transforming it, and passing it into charts, maps, and metrics.
🔥 Streamlit
Streamlit makes it easy to build and deploy data apps with Python, no JavaScript or HTML required. I used:
st.sidebarfor user inputst.metricto show weather conditionspydeckfor mappingplotly.expressfor visualizing air pollutants
🌐 OpenWeatherMap API
A free REST API that provides real-time weather and air quality data:
/weatherendpoint for city coordinates + weather/air_pollutionfor AQI and pollutants
📦 Other Libraries
requestsfor API callspandasfor data transformationplotly.expressfor chartspydeckfor geolocation mapsbase64+ custom CSS for background styling
🧱 Step-by-Step: How I Built the App
1. Initialize the Streamlit app layout
Used st.set_page_config() for page settings and set up a sidebar input for the city name.
2. Connect to the OpenWeatherMap API
Fetched live JSON data using requests.get(), handled edge cases for invalid cities, and extracted latitude, longitude, weather stats, and pollutants.
3. Display core metrics
I used st.columns() to organize and display:
- 🌡️ Temperature
- 💧 Humidity
- 🌬️ Wind Speed
- 🌫️ AQI with color-coded risk levels (e.g., 🟢 Good, 🔴 Poor)
4. Map the city using Pydeck
Rendered a city-level map with a red pinpoint marker showing the exact location entered.
5. Visualize pollutants
Built an interactive bar chart using Plotly, sorted from highest to lowest concentrations of pollutants (PM2.5, CO, O₃, etc.), and displayed values directly on top of each bar.
6. Style the app with a custom background
I added a local background image using base64 encoding and injected it via st.markdown() and inline CSS.
7. Deploy the app on Streamlit Cloud
I pushed my code to GitHub, created a requirements.txt, used the Streamlit Secrets Manager to store my API key, and deployed it live with just a few clicks.
🧠 Skills This Project Showcases
🔢 Data Science
- Real-time data wrangling
- API-driven analysis
- Data visualization and storytelling
🤖 AI & ML-Ready Foundations
- Feature extraction (e.g., pollutants as model inputs)
- Future-ready for adding predictive models
- Could be expanded with LLM-powered pollutant explanations
🧑💻 Software Development
- API integration
- Frontend UI design with layout + CSS
- Secure deployment and environment config
- Live web hosting and version control with GitHub
💡 What I’d Add Next
Here’s how I plan to improve this project further:
- Add a dropdown list of major cities
- Plot historical trends of AQI over time
- Integrate an AI chatbot that explains pollutants using OpenAI or Hugging Face models
- Deploy the app on a custom domain like
olubisi-weather.com - Create a mobile-optimized version
💼 Why This App Matters for My Career
This was more than just a side project — it was a chance to:
- Turn code into something interactive and useful
- Practice skills in real-time data, APIs, visualization, and cloud deployment
- Build a portfolio-ready application that bridges the gap between data and users
🔗 Try the App or View the Code
👉 Live App: https://air-quality-dashboard-2gzqxykalzajvy6ea4jk4t.streamlit.app/
📁 GitHub Repo: github.com/oajetunm/air-quality-dashboard
👋 Let’s Connect
If you’re hiring, collaborating, or just curious — let’s chat!
